Ranking + Recommendations at Scale (Walmart)
Walmart Global Tech · Jan 2024 – Dec 2024
Role
Data Scientist (ML)
Timeline
Jan 2024 – Jan 2024
Team
2 Data Scientists, 1 PM, Backend Engineering Team
My Focus
Architecture Design, End-to-End Pipeline, MLOps
- Business impact
- +10% CTR; +25% Recall@K
- Scale
- Billions of transactions

The Challenge
The Challenge: The Scale Bottleneck
Walmart needed to increase average order value by recommending relevant items to millions of users. However, the existing experience was static and generic.
- The Bottleneck: Our legacy rule-based system could not scale to the massive catalog volume, leading to missed revenue opportunities.
- The Goal: Build a scalable, semantic engine capable of understanding user intent in real-time.
The Architecture
I designed a Two-Tower Recommendation System to capture semantic relationships between users and products:
- Data Processing: Utilized BigQuery and PySpark on Dataproc to process billions of historical transaction logs.
- Model Logic: Implemented BERT embeddings to create vector representations of items, moving beyond simple keyword matching.
- Serving: Deployed the final ranking algorithm (XGBoost) on Vertex AI Endpoints for low-latency real-time scoring.
graph LR
    A[Data Lake<br/>BigQuery] --> B[Feature Engineering<br/>PySpark/Dataproc]
    B --> C[BERT Embedding<br/>Layer]
    C --> D[Ranking Algorithm<br/>XGBoost + Rules]
    D --> E[Serving Infrastructure<br/>Vertex AI Endpoints]
    E --> F[Walmart.com<br/>Personalization]

    G[A/B Testing<br/>Framework] -.->|Metrics| E
    H[Retraining<br/>Pipeline] -.->|Daily| C

    style A fill:#2563eb,stroke:#1d4ed8,stroke-width:2px,color:#fff
    style B fill:#60a5fa,stroke:#2563eb,stroke-width:2px,color:#fff
    style C fill:#2563eb,stroke:#1d4ed8,stroke-width:2px,color:#fff
    style D fill:#60a5fa,stroke:#2563eb,stroke-width:2px,color:#fff
    style E fill:#2563eb,stroke:#1d4ed8,stroke-width:2px,color:#fff
    style F fill:#60a5fa,stroke:#2563eb,stroke-width:2px,color:#fff
    style G fill:#666,stroke:#444,stroke-width:1px,color:#fff
style H fill:#666,stroke:#444,stroke-width:1px,color:#fffThe Impact
We successfully shifted from a manual, maintenance-heavy system to an automated AI pipeline.
| Metric | Legacy System | New Scale-Aware Engine |
|---|---|---|
| Methodology | Manual Rules (Hard to scale) | Deep Learning (BERT + XGBoost) |
| Personalization | Generic / Segment-based | 1:1 Real-Time Personalization |
| Performance | Baseline | +10% Click-Through Rate |
| Recall | Limited Context | +25% Recall@K |
Collaboration & MLOps
This project required tight alignment between Data Science and Product:
- Product Alignment: I worked weekly with Product Managers to translate "user engagement" goals into technical optimization metrics (Recall@K).
- Engineering Handoff: I built the A/B testing framework to ensure a safe rollout, working with backend engineers to ensure the API response stayed under 100ms.
Discover more
Related ML Systems & Business Impact
Explore adjacent case studies that highlight similar technical depth and measurable outcomes.
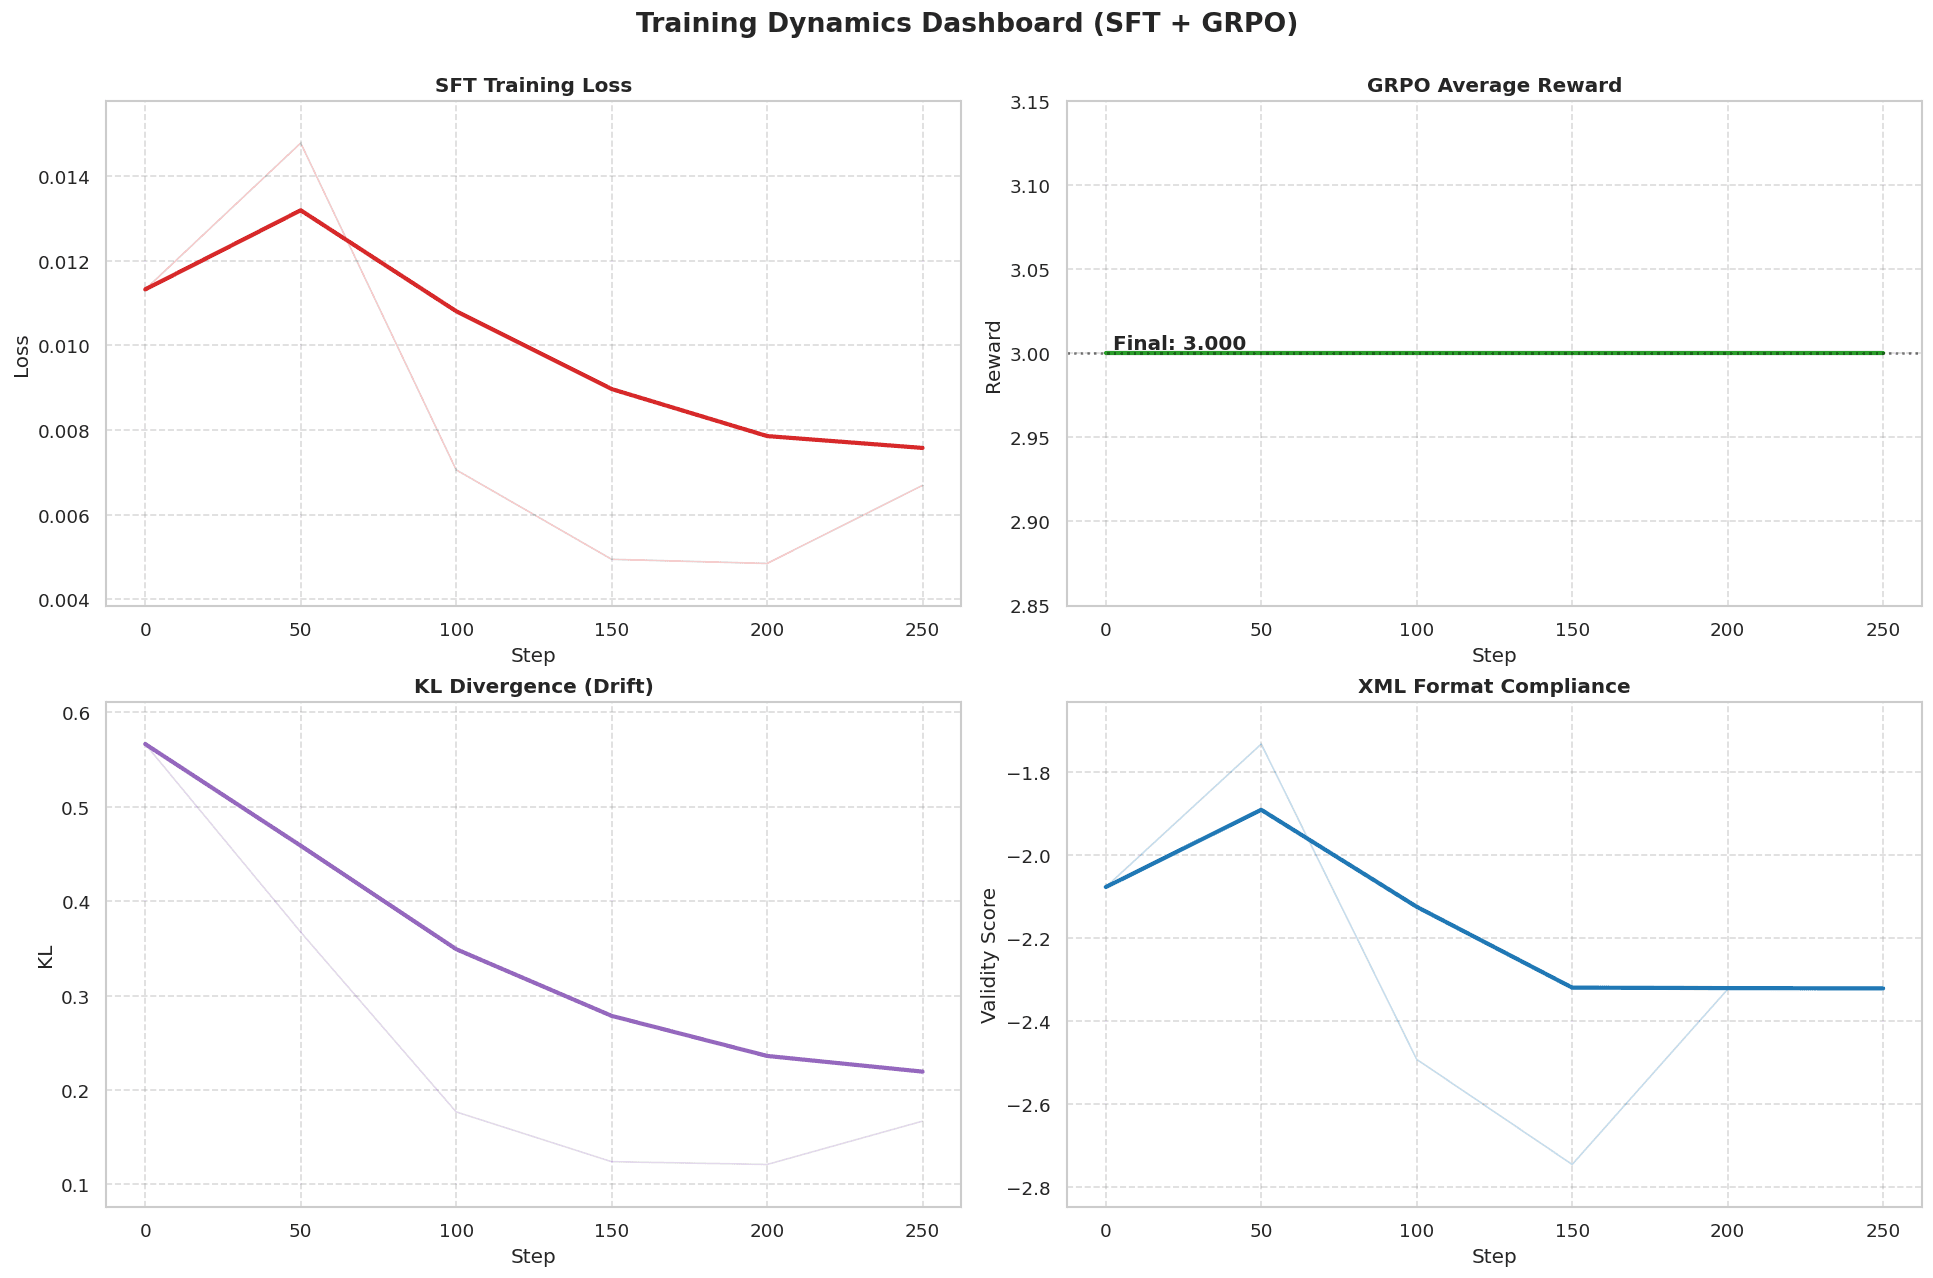
Gemma 3 1B Reasoning Fine-Tuning with Tunix
Outcome: 100% strict XML post-repair (40% raw -> 100% repaired)
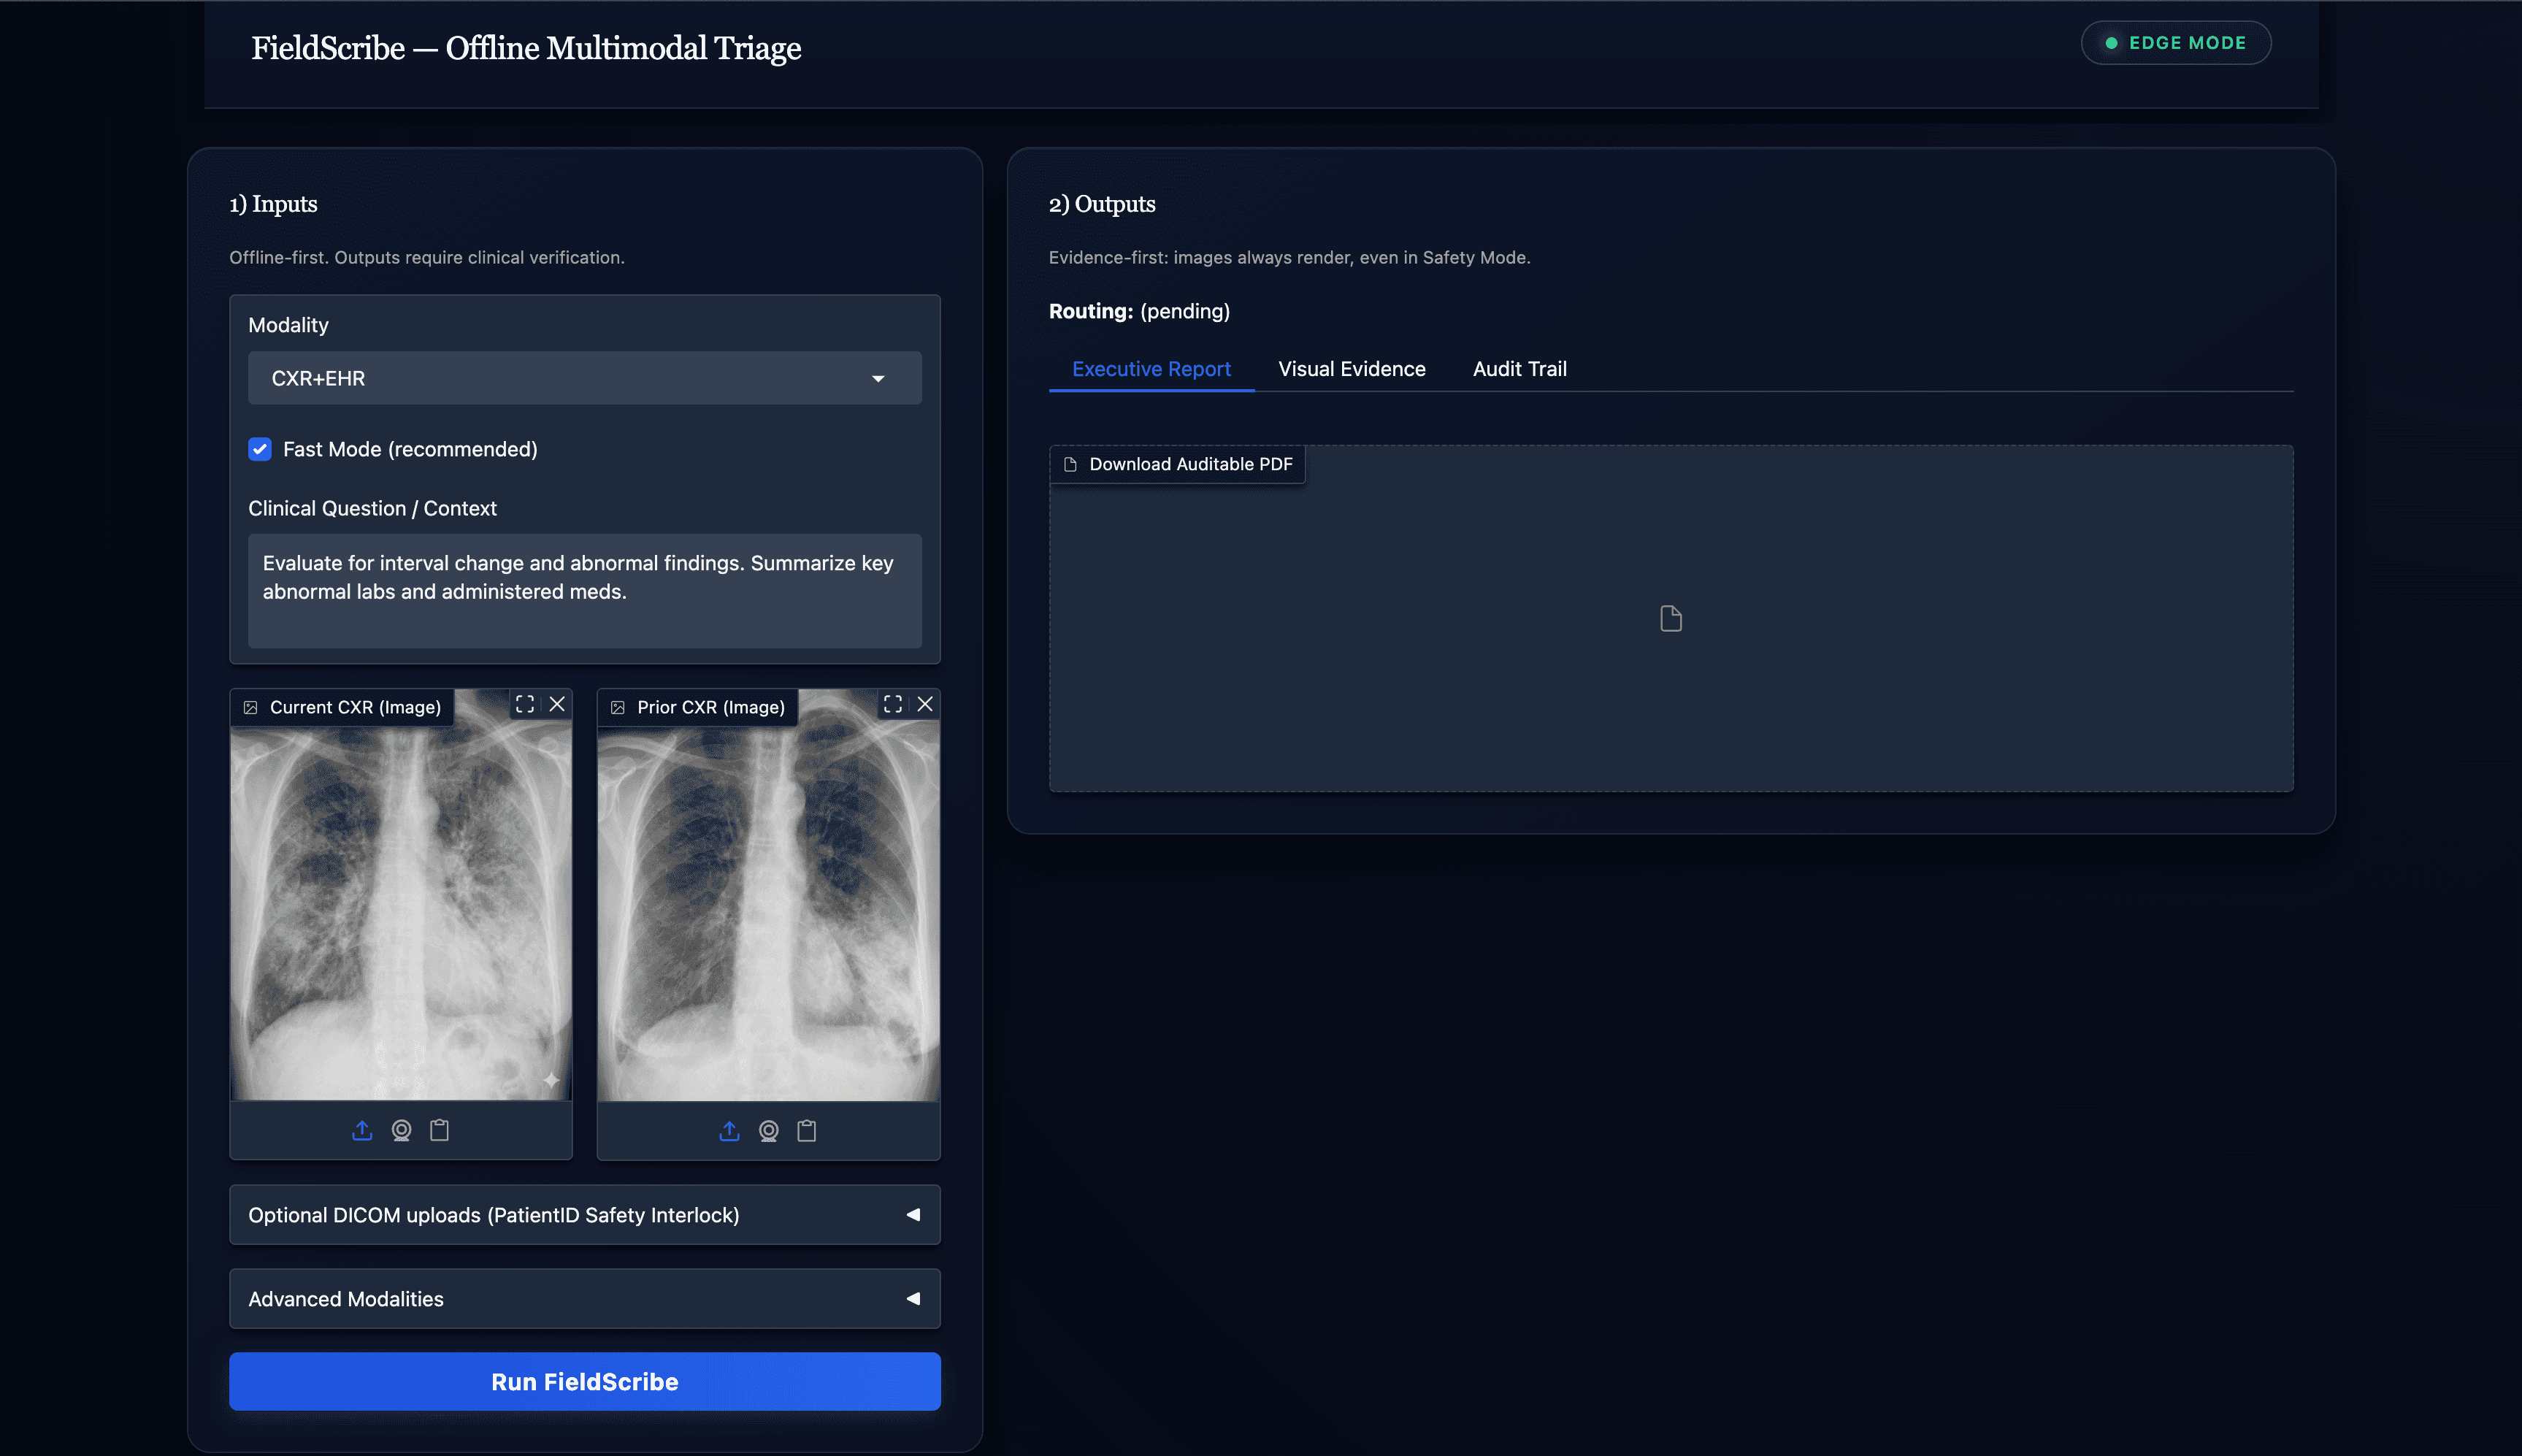
Offline Multimodal Clinical Triage Copilot
Outcome: ~10-14 min saved per complex case

Predictive Logistics + Optimization
Outcome: +30% efficiency; +5% backhaul
Ready to turn AI into measurable business impact?
I partner with teams to ship production ML systems, drive revenue lift, and unlock operational efficiency at scale.